
Why has pricing grains been so much more difficult lately than in previous years? And, for that matter, what makes us at TFM360 feel that price opportunity may improve in 2026? The answer is simple – history shows that there’s a good chance volatility may well go up in 2026.
Where Has Volatility Gone?
Producers expect to see a good amount of price fluctuation over the course of a crop year. While that fluctuation is stressful, the most successful marketers capitalize on volatility. They build and execute plans that capture price when the market is rising and sit tight when the market is falling. And the data bears out producer expectations of volatility.
We’ve analyzed how much median and average prices fluctuate historically for both December corn and November soybean contracts within a calendar year. We start by identifying the closing price on the first trading day of January for each crop since 1990. We then calculate what percentage the market high exceeds the first closing price and what percentage the market low falls below the first closing price throughout that calendar year. Finally, we calculate the calendar year spread from high to low in percentage points. This allows us to quantify yearly median and average volatility since 1990.
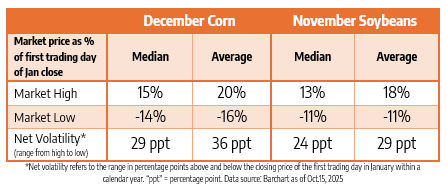
On an average basis, this means that the net volatility (the distance between the market high percentage and market low percentage) tends to be around a 36 percentage point range from low to high for corn, and a 29 percentage point range for soybeans. Likewise, you might expect prices to fluctuate up to an average 20% above and 16% below the initial closing price at the beginning of the year for corn, and between 18% above and 11% below the initial closing price at the beginning of the year for soybeans.
Having said this, a year like 2025 has been very difficult for you. The data in the table below shows a net volatility for corn of about 19 percentage points (only 7% up and 12% down). The 2025 December corn contract (as of 10/15/2025) has traded in the second tightest range in the past 35 years. The 2025 November soybeans contract (as of 10/15/2025), with net volatility of only 9 percentage points (4% up and 5% down), has traded in the tightest range over the same time frame. While prices didn’t really fall, they didn’t rise either. All in all, these flat prices have offered you scant opportunity to capture any upside volatility in this trading year. Accordingly, many marketers are hopeful that next year will be better, and a key component of “better” is more potential opportunity through increased volatility.
Quiet Years Tend to Be Followed by Active Years
Generally speaking, lower net volatility years tend to be followed by more activity in the following year, which – at a minimum – means that you should be alert for opportunities and risks as they arise.
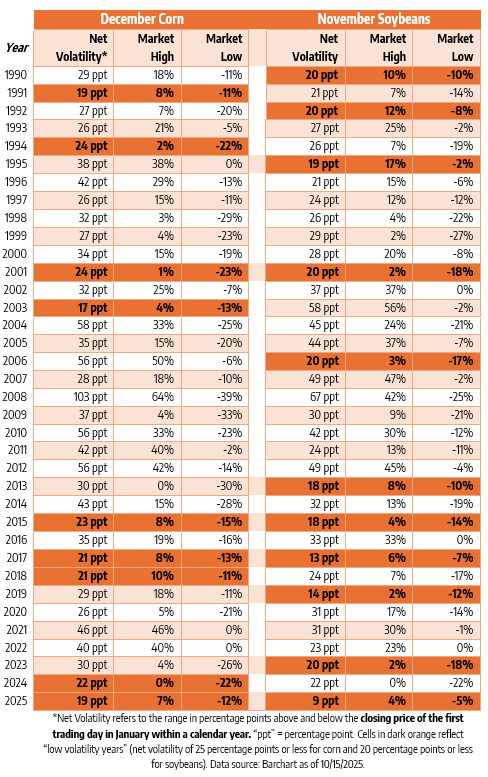
Take a look at the chart below, which details how much the calendar year high or low is above or below the first January closing price on a percent basis for December corn and November soybeans since 1990. In general, regardless of how low or high net volatility levels are, if volatility falls in one year, it tends to rise in the next. The exceptions to this lend credibility to the idea that an increase in volatility is historically probable:
- For corn, volatility fell in 1993 and again in 1994 before rising again, whereas volatility fell in 2017 and remained constant in 2018. The years 2022 – 2025 were quite unusual, in that volatility fell four years in a row.
- Soybeans also experienced a few years where volatility fell multiple years in a row, including 1994 – 1995, 2004 – 2006, and 2022 – 2023.
Although past behavior is no guarantee of future behavior, this pattern suggests a possibility for a rise in volatility in 2026.
Exceptionally Quiet Years Tend to Be Followed by Upward Volatility
The reality is that after a couple of tough years, producers are looking for more upward potential, not just more volatility. The data is promising, showing that net volatility after a low volatility year often rises with meaningful upward potential. To demonstrate this, we’ve highlighted low volatility years in dark orange in the chart above, which for the sake of argument are any net volatility numbers at or below 25 and 20 percentage points for corn and soybeans, respectively. (In contrast, the median net volatility figures for corn and soybeans are 29 and 24 percentage points respectively, as shown in the first table above).
- For the nine “low volatility” years for corn, there has only been one time period where volatility has fallen two years in a row, and that notable exception is in 2024 and 2025. Of note, every year except 1991 saw higher price potential in the following year (Market High percentage increased), and often by a significant amount. (We are excluding 2025 because we don’t know what 2026 will bring.)
- Ignoring 2025, soybeans saw an increase in volatility each of the 10 years following a “low volatility year,” and seven out of those ten years saw an often healthy increase in price potential (as shown by an increase in the Market High percent in the chart).
- Bear in mind: net volatility does not always offer both upward and downward price potential. Volatility can be one-sided and weighted towards upside volatility (like 2011 or 2021 for corn) or downside volatility (like 2009 or 2024 for soybeans).
Get Ready
Will volatility increase next year? Who’s to say? Volatility could be triggered by good weather, or bad. It could be continued weakness in the dollar or unanticipated strengthening. It could be escalation of foreign tensions or a claw back. And then there are the white or black swan events with the potential to spark a market up or down. While we don’t know how much volatility the market may bring, data over the past 35 years show us that it is smart and prudent to prepare for it:
- You need to be alert to changes that affect the direction of the market.
- You need a plan to understand when to pull the trigger on market action or to sit tight so that you don’t miss out on market momentum.
- You need to prepare emotionally for the stress – and potential – that more volatile markets offer.
At TFM360, we have helped farmers through bull markets and bear markets and through volatile markets and flat markets. We can help you make decisions to help you capitalize on the potential of volatility and to help protect you from the downside. We’ve worked with producers for 40 years and look forward to working with you in the next decade and beyond.
This year, Total Farm Marketing is celebrating our 40th year helping farmers.
Give us a call at 800.334.9779 to discuss your situation and how we can help you in your marketing decisions.
©November 2025. Total Farm Marketing. Futures and options trading involve significant risk of loss and may not be suitable for everyone. Therefore, carefully consider whether such trading is suitable for you in light of your financial condition. No representation is being made that scenario planning, strategy or discipline will guarantee success or profits. Examples of seasonal price moves or extreme market conditions are not meant to imply that such moves or conditions are common occurrences or likely to occur. Futures prices may have already factored in the seasonal aspects of supply and demand. The data contained herein is believed to be drawn from reliable sources but cannot be guaranteed. Reproduction of this information without prior written permission is prohibited. This material has been prepared by a sales or trading employee or agent of Total Farm Marketing and is, or is in the nature of, a solicitation. Any decisions you may make to buy, sell or hold a futures or options position on such research are entirely your own and not in any way deemed to be endorsed by or attributed to Total Farm Marketing. Total Farm Marketing refers to Stewart-Peterson Group Inc., Stewart-Peterson Inc., and SP Risk Services LLC. Stewart-Peterson Group Inc. is registered with the Commodity Futures Trading Commission (CFTC) as an introducing broker and is a member of National Futures Association. Stewart-Peterson Inc. is a publishing company. SP Risk Services LLC is an insurance agency and an equal opportunity provider. A customer may have relationships with any of the three companies.
Author
Mike Vigneau