
Last month we talked about the influence of hedge funds on the price of commodities. A key takeaway? Hedge funds are simply opportunistic, based on their perception of how to turn a profit in any market condition. Unlike farmers that are always net sellers, hedge funds are net buyers when the market is in favor of buyers and net sellers when the market is in favor of sellers. With the combined volume of contracts bought and sold through them, hedge funds have the capability to quickly turn a bear market into a bull market – and a bull market into a bear market. (See July 2023’s Managed Money Part 1: What Has It Done for You Lately?)
The question, of course, is how to use information about hedge funds to your advantage. Luckily, because hedge funds are (loosely) regulated, they are required to report positions (referenced as Commitment of Traders or COT data) on a daily basis. This information is then released to the public every Friday afternoon by the Commodity Futures Trading Commission. As a result, you have access to historical and real-time information on the funds that you can use as you make your marketing decisions.
Movement within Limits
Let’s take a look at a COT chart for corn, which is an easy way to assess how funds are positioned. The green represents daily net hedge fund positions for corn since 2006. Net long positions are above the line and net short positions are below the line. Overlaid in red is price over the same period of time, including the impact of rolled contracts.
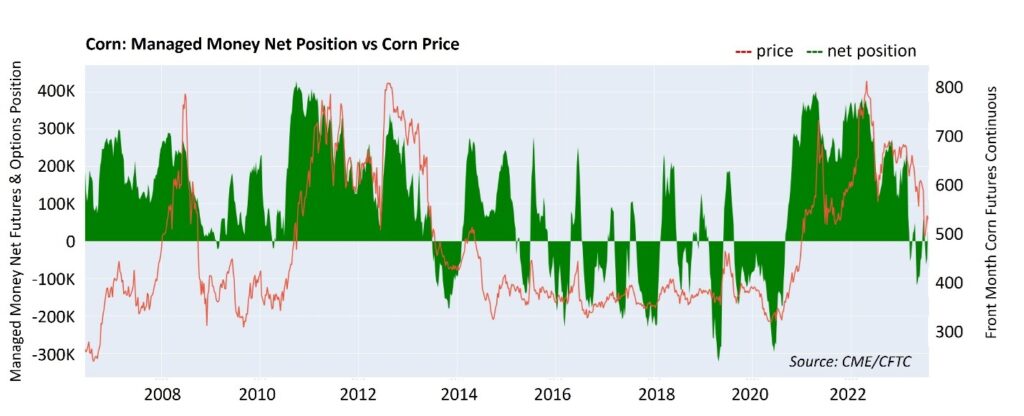
In general, you can see that, directionally, price and fund’s net positions move together, which is a good indicator of the fund’s influence on price. Despite this correlation, bear in mind that the charts can’t help you predict, generally, where positions or prices are headed. Every day, hedge funds are making decisions about whether to exit, hold, or get shorter or longer, based on their unique strategies and their reactions to the fundamentals. Trying to anticipate their movements is as fruitless as predicting the market.
However…
… as hedge funds become increasingly exposed long or short, fewer and fewer outside participants are willing to enter the market in the same direction. As a result, each hedge fund knows that the opportunity to lock in a gain is closing. It’s at this point that funds start reversing course. At extreme long or short positions, the sell-off of one fund triggers the next and then the next, and suddenly the market is changing direction. After all, hedge funds don’t want to be caught with a large position in an unfavorable market. And while the chart doesn’t promise you what prices will do, it does indicate that there’s a limit to how large a position the funds, in aggregate, are willing to take on before they start reversing their positions and influencing an often-significant market change. In other words, when the aggregate position becomes too long or short, there’s a point where the funds will only move in one direction: namely, to reverse their position, which also reverses price direction.
How do you know if a corn market reversal is likely imminent?
- Are funds long 300k – 400k contracts or are they short 150k – 200k or more? It appears that, once the funds reach these extremes, all they need is a trigger to set off a chain reaction of buying or selling.
- What is going on fundamentally? The right or wrong fundamental can set off the market reaction when it doesn’t align with the currently held fund position.
Bottom line? When the funds are extremely long, beware that the market could be near the top. Evaluate your sell strategy and make adjustments. When the funds are extremely short, practice patience before you make a sale. In both cases, a reversal is going to happen at some point. It’s just a matter of what sets it off.
Let’s zoom into the chart to look at some examples:
- In 2013, the funds were long by around 300k contracts before the market reversed. What triggered the change? It appears prices were too high to be affordable, combined with a return to production and weather normalcy.
- In early 2019, funds were short by almost 300k contracts. Funds exited their short positions and went long as prices rallied, likely on the news of late planting due to flooded fields and the flooding of the Mississippi and Missouri rivers.
- In early 2020, funds increased their shorts from about 80k to almost 300k during the start of COVID, and then exploded into a long position of around 400k contracts, likely triggered by a shortage of corn and increased demand from China. Prices rallied by more than $4.00.
What don’t you see? Any significant outlier in short or long positions that might cause you to wait to see if the movement would maintain direction.
Keep in Mind
It’s never a good idea to try to second guess or anticipate fund activity. Although they may act like pack animals at the extremes, within those limits they are unique entities managing strategies that probably don’t make any sense to outsiders.
Instead, make sure you have a solid marketing strategy that prepares you for whatever the market may do, whether bull or bear, big or small. Make sure it includes incremental sales to help you capture bite-sized pieces of the market and to avoid missing out on a rally or waiting too long. Of utmost importance, build in ongoing analysis and flexibility to respond to market changes.
Finally, work with your TFM advisor to ensure that your plan aligns with the needs of your operation.
Questions?
Give Total Farm Marketing a call at 800.334.9779.
We look forward to discussing how we can help you set a pricing strategy suited to the needs of your organization.
Author
Scott Masters