
Corn planted progress across the U.S. was seen at 95% complete as of Sunday, May 30. The corn crop was rated at 76% good to excellent as well. The only state of the top ten corn-producing states in the U.S. below the five-year average planting pace for this week was Kansas. Planting across the entire U.S. has been ahead of the five-year average since late April. This quick planting pace into great soil conditions and favorable weather has been a major driver in the $1+ correction the corn market has seen in May. As of May 25, approximately 24% of corn production was within an area experiencing some sort of drought stress. These areas picked up some much-needed rainfall late last week to help alleviate the immediate dryness concern. A favorable weather forecast into mid-June has added to a feeling of anxiousness in the corn market as of late. While this crop is far from “in the bin,” it appears to be off to a great start for much of the Corn Belt and surrounding U.S.
Corn seed genetics and technology have made huge improvements over the last twenty years, improving trendline yields by 2.13 bushels per acre per year! However, these seed genetics and other agronomic practices can only do so much. Mother Nature will have the say when it comes down to the national corn yield. To get a better guess as to how Mother Nature may act into the summer months, some use The Oceanic Nino Index from NOAA for identifying El Nino (warmer than normal) and La Nina (cooler than normal) events in the tropical Pacific. Early on in 2021, Pacific Ocean temperatures have been abnormally cool, categorizing this year as a La Nina. Going back to the year 2000, eight years have been categorized similarly to 2021 as a La Nina year. Of those eight years, six have resulted in above-trendline national corn yields. The remaining two years (2011 and 2012) ended with below-trendline yields. We all know and remember what happened in 2012. Statistically speaking, given history of previous La Nina years, odds are in favor of trendline to above-trendline yields in 2021. The USDA estimated 2021 yields at 179.5 bushels per acre in their May WASDE report. This is above the trendline yield for 2021, which comes in at 178.4 bushels per acre. Keep in mind, this USDA yield estimate is for a crop that was just planted and will surely change in the months to come. Regardless of El Nino or La Nina, only two years since 2000 has the national corn yield been +/- 10% off trendline yield. In 2004, the national average corn yield came in 11.2% above trendline. In 2012, due to the drought, national corn yields came in nearly 30% below trendline. Bottom line, regardless of this year being a La Nina year, odds are in favor of corn yields being well within 10% of trendline in 2021.
With substantial outside interest in the corn market this year, chatter about yield expectations and weather outlooks will be abundant. While the corn-growing season is just getting underway in 2021, the goal of this article is to provide a baseline of data referencing historical figures to keep in mind when preparing the “what-if” scenarios for U.S. corn supply in 2021.
Corn prices have fallen (and fallen sharply) in the last few weeks and remain near multi-year highs. In the last six years, front month futures have traded below the $5 mark and were mostly stuck in the $3+ range. While you may feel as if you have lost out on higher prices during planting, now is still a good time to develop a strategy to be well positioned, regardless of price direction the rest of the year. Volatility is here to stay, as outside interest in the commodity markets continues to build. Don’t miss a quick-moving opportunity because you were unprepared. Sign up for daily TFM market updates and always stay in the know: https://info.totalfarmmarketing.com/market-updates

(La Nina years since 2000 – 2001, 2006, 2008, 2009, 2011, 2012, 2017, 2018) https://ggweather.com/enso/oni.htm
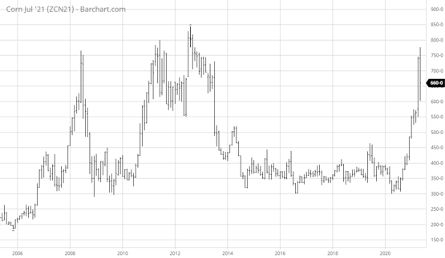
Continuous Corn Chart (Monthly)
Total Farm Marketing and TFM refer to Stewart-Peterson Group Inc., Stewart-Peterson Inc., and SP Risk Services LLC. Stewart-Peterson Group Inc. is registered with the Commodity Futures Trading Commission (CFTC) as an introducing broker and is a member of National Futures Association. Stewart-Peterson Inc. is a publishing company. SP Risk Services LLC is an insurance agency. A customer may have relationships with all three companies. Futures and options trading involve significant risk of loss and may not be suitable for everyone. Therefore, carefully consider whether such trading is suitable for you in light of your financial condition.
Author
Keegan Madigan