

Record-high dairy cow numbers, weaker butter and cheese markets, and shifting global prices are creating new challenges for the U.S. dairy market and milk price outlook.
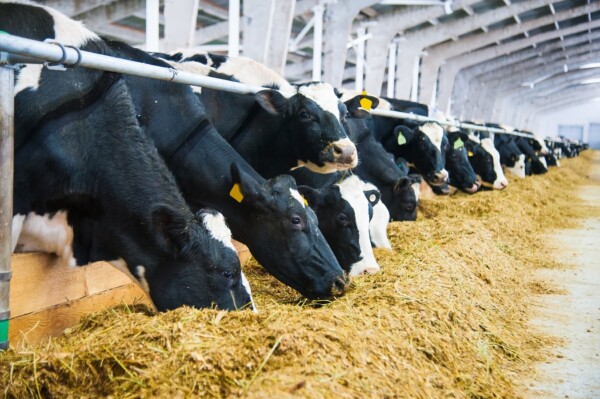
The U.S. dairy industry is facing mounting pressure in the weeks ahead. Bearish signals are building across nearly every corner of the market. Butter prices have fallen to five-year lows, the cheese market remains under pressure as inventories begin to build, and export demand is waning. Meanwhile, the U.S. milking cow herd continues to expand, reaching all-time highs as producers add cows and keep production strong. With supply expanding faster than demand, the market may need to move prices lower to encourage a slowdown in expansion and restore balance. Milk prices now face an uphill battle.
A Growing U.S. Dairy Herd Increases Milk Supply
Perhaps the biggest headwind facing the dairy market is the mountain of milking cows that grows larger each month. Dairy producers have been expanding herd size for quite some time now as a result of record high cattle prices. With how valuable calves are, it’s more beneficial to put an older cow through another milking cycle than to cull it. Breeding habits have changed as replacements are hard to find. The extra revenue from day-old calves has been extremely helpful to get producers through these middle-of-the-road milk prices. The getting has been good, but could lead to a disastrous outcome as the herd grows.
Let’s look at the current cow situation. At the end of July, the USDA reported a total milking cow herd size in the United States of 9,710,000 cows. This is up a whopping 199,000 dairy cows from the same month last year. So far in 2026, the U.S. milking cow herd has increased by an average of 20,571 cows per month. This just isn’t sustainable. By comparison, before these expansions picked up speed, 2024 had an average 2,916 cow increase per month while 2023 had an average 5,000 cow decrease per month. We haven’t seen expansion like this in quite some time, if ever.
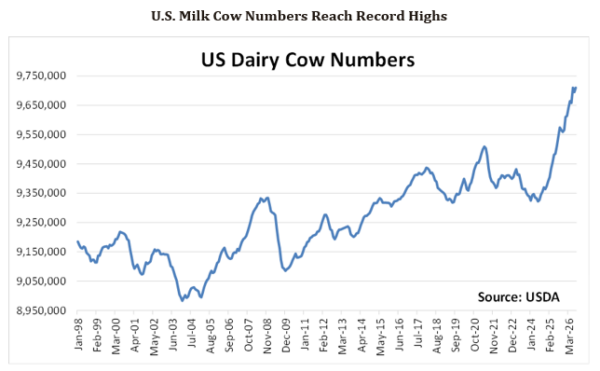
It’s anyone’s guess how high this cow figure can get before the U.S. hits capacity, but the one thing that is for sure is that there will be a tipping point. It’s simple supply and demand economics. When supply gets too high, the market will need to shift to lower levels to find an equilibrium and to slow production. What this could take from the dairy industry could be low milk prices to slow expansion, increase culling, and to bring that cow figure down.
Butter Prices Reflect Growing Supply Pressure
Several markets within the dairy industry have already started to feel the ill effects of record cow numbers, and there will likely be more downside to come before all is said and done. Take the butter market, for example. At the time of this writing, the U.S. butter market has been pressured down to five-year lows. Second month butter holds around $1.40/lb. after trading above $2.15/lb. earlier this year. The market has traded mostly straight down following a sharp rally in February. This downward pressure can be linked directly to the fundamentals.
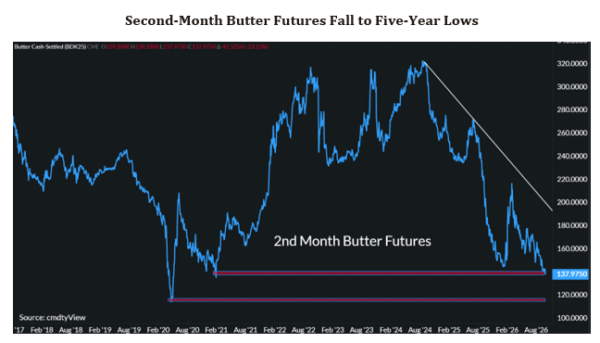
In the most recent Eastern U.S. butter report, the USDA said that milk production and cream supplies remain plentiful across the Northeast. Out West, it’s being reported that domestic butter demand is flat to weak, with low retail sales. There is strong churn activity, and cream availability has improved in the region. With updates like this, it’s no surprise the market has a bearish tone and could take some time to recover.
Cheese Production and Inventories Continue to Build
Over in the cheese market, the “boots on the ground” reporting gives off a similar vibe. The Central U.S. cheese report cited spot cheese loads as being readily accessible. Food service demand is below anticipated levels. Out East, milk availability for cheese production remains steady, supporting consistent plant schedules. Current inventory is ample. And in the West, manufacturing facilities continue to be fully supplied, and cheese production schedules are stable.
The official cheese output data from the USDA tells a similar story. It was reported in July that total U.S. cheese production was 1.26 billion pounds, up 2.10% from July 2025 and up 2.30% from the month prior. Cheese production has been on the rise for quite some time, because of all the excess milk on the market. This extra production has led to a rise in inventory. As of July 2026, total U.S. cheese stocks came in above the figures from both July 2025 and July 2024 (+0.35% and +2.11%, respectively).
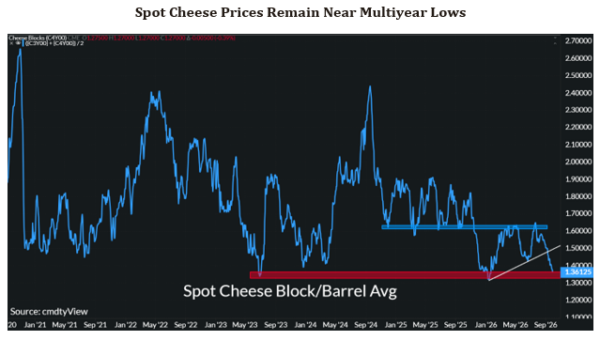
Increased cheese inventories and expectations for even more production coming online in the months ahead have contributed to a lower U.S. cheese market this year. The U.S. spot cheese block/barrel average cheese price currently trades near $1.40/lb. This level isn’t too far off from multiyear lows. What’s more, the market spikes in 2026 have been very shallow. The high of the year is only $1.65/lb., which compares to a 2025 high of $1.90875/lb. and a 2024 high of $2.4425/lb.
Global Dairy Prices Could Challenge U.S. Exports
Another new development in the past month or so that could mean lower prices for longer is that the global market is under duress. From April 7 through July 7, the Global Dairy Trade (GDT) price index saw heavy selling pressure and had five overall down auctions out of the seven events during that stretch. During this time, the index fell nearly 12%. The global butter market has since fallen to its lowest level since 2023, and global cheese just recently hit a five-year low.
This steady decline in the global market means that U.S. exports could take a hit moving forward. A large driver of higher milk prices at the start of the year was the fact that U.S. markets were extremely discounted to global levels, but the drop in global prices means that competitive advantage is now gone. Earlier this year, the block/barrel average U.S. cheese price on the CME was between $0.70 and $0.76/lb. cheaper than the GDT price index. However, the recent decline in GDT had tightened that margin to where in July the U.S. market was actually $0.02/lb. more expensive than GDT cheese. Additionally, the U.S. butter market was roughly $1.15/lb. cheaper than GDT levels back in February – but that has now shifted to just an $0.80 spread.
What the 2026 Dairy Market Outlook Means for Producers
Taken together, these factors suggest the dairy market may be entering a particularly rough stretch. Seasonal trends typically point to lower prices to come as the industry moves past the holidays and into the Spring Flush. Peak production is right around the corner and if we have record cows producing peak milk, it could be a shock to the market. There are still some bright spots that should be noted, however. The powder and whey markets remain strong, which do provide overall support to the dairy complex. The feed market has shot up recently as well, making it more expensive to produce milk. But the weight of the cheese and butter markets may prove too difficult to overcome.
For dairy producers, this is not a market to take lightly. With downside risks building and the potential for additional pressure ahead, producers should protect against lower prices and consider extending that protection well into the future.
Prepare for the Market Ahead
With downside risk building, now is a good time to evaluate how your operation is positioned for the market ahead. Whether you’re already working with Total Farm Marketing by Stewart-Peterson or exploring your options, we can help you evaluate strategies for managing milk price risk.
TFM360 Dairy from Stewart-Peterson Inc. and Dairy Revenue Protection insurance through SP Risk Services LLC offer different approaches to help manage that risk.
Contact your Total Farm Marketing representative or call 800.334.9779 to discuss your risk management options.
More Market Insights from Total Farm Marketing
Explore the latest market perspectives, analysis and educational resources from Total Farm Marketing by Stewart-Peterson.
Read more TFM Team Insights | Visit our Dairy Market Commentary | Market Guides
©October 2026. Total Farm Marketing. Futures and options trading involve significant risk of loss and may not be suitable for everyone. Therefore, carefully consider whether such trading is suitable for you in light of your financial condition. No representation is being made that scenario planning, strategy or discipline will guarantee success or profits. Examples of seasonal price moves or extreme market conditions are not meant to imply that such moves or conditions are common occurrences or likely to occur. Futures prices may have already factored in the seasonal aspects of supply and demand. The data contained herein is believed to be drawn from reliable sources but cannot be guaranteed. Reproduction of this information without prior written permission is prohibited. This material has been prepared by a sales or trading employee or agent of Total Farm Marketing and is, or is in the nature of, a solicitation. Any decisions you may make to buy, sell or hold a futures or options position on such research are entirely your own and not in any way deemed to be endorsed by or attributed to Total Farm Marketing. Total Farm Marketing refers to Stewart-Peterson Group Inc., Stewart-Peterson Inc., and SP Risk Services LLC. Stewart-Peterson Group Inc. is registered with the Commodity Futures Trading Commission (CFTC) as an introducing broker and is a member of National Futures Association. Stewart-Peterson Inc. is a publishing company. SP Risk Services LLC is an insurance agency and an equal opportunity provider. A customer may have relationships with any of the three companies.
SP Risk Services LLC is an insurance agency and an equal opportunity provider. Issuance of insurance coverage is subject to underwriting review and approval. SP Risk Services LLC is not licensed in all states. Please see the policy for the full terms, conditions, and exclusions. SP Risk Services LLC is an insurance agency licensed to sell certain insurance products and may receive compensation from insurance companies for such sales. Policy obligations are the sole responsibility of the issuing insurance company. Any coverage scenarios are hypothetical and shown for illustrative purposes only. Any claims made pursuant to any policy are adjusted by the issuing insurance company. Insured is responsible for accuracy of information provided to SP Risk Services and its insurance companies. The information included in or available through the website may include inaccuracies or typographical errors. SP Risk Services LLC may make changes or improvements to the website at any time. Information received via the website should not be the sole basis for risk management decisions. Consult a licensed insurance agent (which does not have to be an SP Risk Services LLC agent) for information and advice specific to your situation. Go to https://www.totalfarmmarketing.com/privacy-policy/ for Privacy Notice & Non-Discrimination Statement and https://www.totalfarmmarketing.com/terms-of-use/ for Terms of Use.
Author

Evan Disher