

Common economic wisdom tells you that price is set by demand and supply. This truism leads many farmers to wait to make sales to see if they can capture any increase in price as more information emerges about crop size. After all, if we end up having less supply, prices should react accordingly, right?
Well, not really. As we discussed in December of 2023, futures prices for corn and soybeans are not exactly driven by supply and demand; instead, futures prices are driven by expectations of supply and demand. Long before buyers and sellers of corn and soybeans know exactly what supply and demand will ultimately look like, they’re taking positions in the market to make sure they are covered for the year ahead. As harvest increasingly approaches, the market usually reacts only to infrequent surprises that go against market consensus, and prices generally continue to decline as the market data reinforces supply and demand expectations. This pattern of recurring price tendencies which tend to occur on a calendar basis year after year are called seasonal price patterns, or seasonals for short.
Seasonals: Important Implications about the Price You Get for Your Grain
Seasonals are price patterns based on average prices for a commodity such as corn or soybeans over an extended time period that demonstrate how prices tend to rise and fall over the course of the year. They are tied to the crop calendar and are influenced by factors such as acreage planted, planting risk, growing season weather premium, harvest pressure, and export demand. It’s important to note that seasonals are probabilities that fluctuations in prices generally occur at regular periods during a calendar year and are not a guarantee of future prices or market activity.
Let’s take a look at 15-year seasonal charts for both corn and soybeans and how a marketer might use them to take advantage of pricing opportunities. As we explore how to read and use the charts as part of your marketing plan, keep in mind three important implications that can make a big difference in the weighted average price you receive for your grain:
- Making pricing decisions during periods of greatest uncertainty often offers the best pricing opportunities.
- Waiting to price the bulk of your grain until closer to harvest often means waiting until the market has the most information and the least inclination to offer a premium.
- Seasonals give you a sense of how prices fluctuate on average. They can’t tell you what prices could be or magnitude of change; instead, they can show you generally when prices move higher and lower. A structured approach to marketing your crop can help you capture price during a typical season as well as during occasional surprises when prices move against typical patterns.
The Corn Seasonal Pattern: Selling Far Earlier Can Help
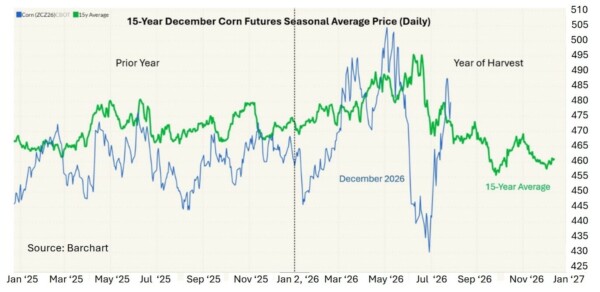
Each daily point in the corn seasonal pattern below (in green) averages 15 years of corn prices per day spanning two years of data, including pricing patterns a year before the contract year (“Prior Year”) and the year of the contract year (Year of Harvest). Note that the seasonal chart’s Year of Harvest follows the general pattern we described above where prices tend to be higher during the greatest time of uncertainty about crop size in the summer before harvest, and then even out at lower prices as harvest begins approach.
We’ve also included the 2026 contract (in blue), which topped out June 9 and has since fallen and risen again, echoing the seasonals chart. More broadly, the 2026 December futures prices as of July 28 has followed a similar price movement to the 15-year average history but with wider price swings. Year to date, it appears that taking guidance from the seasonals may contribute to a higher average price.
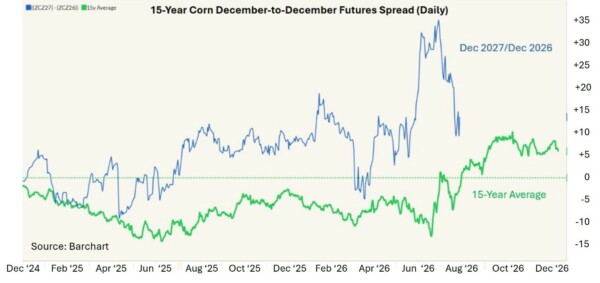
Corn producers have another potential ace up their sleeve when it comes to integrating seasonals into their marketing. Consider that in any given crop year, futures prices on next year’s corn contract can be higher than this year’s. This is what the market calls “carry.” This makes sense. After all, there’s more uncertainty in next year’s crop than this year’s. Furthermore, the carry can increase as the growing season progresses and more becomes known about the current crop size, typically sometime between April and July. This presents a potential opportunity for producers to sell early on next year’s crop.
This is demonstrated below in a seasonal corn chart (in green) showing how much average premium there is on a sale of next year’s December corn less this year’s based on 15 years of data. In 10 of the last 16 years, the spread has moved into a carry by summer: this past July 15 (in blue), for example, December 2027 futures closed 21 cents higher than the December 2026 contract. Without the guidance of seasonals, most producers overlook pricing opportunities this far ahead of planting. However, when capturing price is a priority, opening your marketing window earlier is one factor that has historically been associated with improved realized average price.
The Soybean Seasonal Pattern: Patience Is the Name of the Game
It’s generally advantageous to sit tight when making soybean sales. As the 15-year seasonals for soybeans shows (in green below), soybean futures highs typically hit later in the 2-year window than corn. Prices are influenced by weather risks in both the North American and South American growing seasons, and by the pace of Chinese new-crop export purchases which typically accelerate as harvest approaches. As harvest nears and demand becomes clearer, the market shifts its focus to evaluating this growing demand against the size of the crop, often resulting in additional price discovery after the early marketing window.
Like we saw with corn, 2026 soybean prices (below in blue) are broadly matching the peaks and valleys of the seasonals, albeit with much greater magnitude. Interestingly, 2026 prices rallied to an early high the same day as corn on June 9 and have since rallied again, and higher, echoing seasonals.
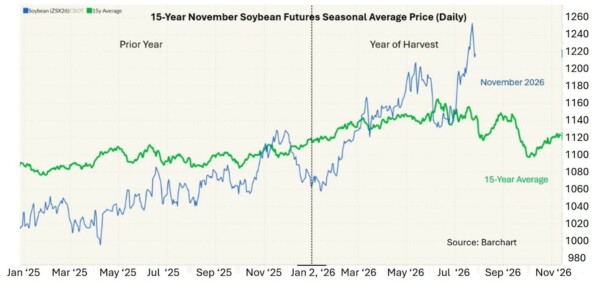
Unlike corn, selling next year’s soybean crop early does not generally benefit sellers and could have a potential negative impact. That’s because the November soybean futures spread from crop year to crop year is usually inverted, which means the current crop price is higher than next year’s.
Seasonals As a Marketing Tool
To be clear, seasonals alone are not sufficient on their own to decide when to sell or buy. Think of them, instead, as guidelines to help you target timeframes for making marketing decisions based on other important factors as part of a methodical marketing plan. For instance, consider completing the bulk of your corn sales by mid-July when prices tend to fall. In general,
- Plan incremental sales based on preset targets that help take bites out of the market to build your price as the market rises based on other factors like technicals, fundamentals, and managed-money trader positions.
- Prepare for those occasional surprises when prices rally after a seasonal pattern indicates they should by layering call options into your strategy to capture upside potential. Remember, there are years like 2012 and 2020 that depart from the norms. Part of smart marketing is to make sure you have strategies to take advantage of unanticipated opportunities to capture price.
- Finally, on the off chance that you don’t sell your grain prior to seasonal lows, think about how you can use storage to hold out for a better seasonal timeframe to sell. Make sure you understand the opportunities and risks by taking a second look at our Insight from this past September.
Total Farm Marketing Can Help
Like all marketing tools, the use of seasonals are best utilized as part of a comprehensive marketing plan. Stewart-Peterson Inc. (part of Total Farm Marketing) has evaluated the markets across 40+ market indicators, and developed models and marketing approaches to help our farmers get the most for their hard-earned production.
Give Total Farm Marketing a call at 800.334.9779 to discuss your situation and how we can help you in your marketing decisions.
©August 2026. Total Farm Marketing. Futures and options trading involve significant risk of loss and may not be suitable for everyone. Therefore, carefully consider whether such trading is suitable for you in light of your financial condition. No representation is being made that scenario planning, strategy or discipline will guarantee success or profits. Examples of seasonal price moves or extreme market conditions are not meant to imply that such moves or conditions are common occurrences or likely to occur. Futures prices may have already factored in the seasonal aspects of supply and demand. The data contained herein is believed to be drawn from reliable sources but cannot be guaranteed. Reproduction of this information without prior written permission is prohibited. This material has been prepared by a sales or trading employee or agent of Total Farm Marketing and is, or is in the nature of, a solicitation. Any decisions you may make to buy, sell or hold a futures or options position on such research are entirely your own and not in any way deemed to be endorsed by or attributed to Total Farm Marketing. Total Farm Marketing refers to Stewart-Peterson Group Inc., Stewart-Peterson Inc., and SP Risk Services LLC. Stewart-Peterson Group Inc. is registered with the Commodity Futures Trading Commission (CFTC) as an introducing broker and is a member of National Futures Association. Stewart-Peterson Inc. is a publishing company. SP Risk Services LLC is an insurance agency and an equal opportunity provider. A customer may have relationships with any of the three companies.
SP Risk Services LLC is an insurance agency and an equal opportunity provider. Issuance of insurance coverage is subject to underwriting review and approval. SP Risk Services LLC is not licensed in all states. Please see the policy for the full terms, conditions, and exclusions. SP Risk Services LLC is an insurance agency licensed to sell certain insurance products and may receive compensation from insurance companies for such sales. Policy obligations are the sole responsibility of the issuing insurance company. Any coverage scenarios are hypothetical and shown for illustrative purposes only. Any claims made pursuant to any policy are adjusted by the issuing insurance company. Insured is responsible for accuracy of information provided to SP Risk Services and its insurance companies. The information included in or available through the website may include inaccuracies or typographical errors. SP Risk Services LLC may make changes or improvements to the website at any time. Information received via the website should not be the sole basis for risk management decisions. Consult a licensed insurance agent (which does not have to be an SP Risk Services LLC agent) for information and advice specific to your situation. Go to https://www.totalfarmmarketing.com/privacy-policy/ for Privacy Notice & Non-Discrimination Statement and https://www.totalfarmmarketing.com/terms-of-use/ for Terms of Use.
Author

Marianne Janka