

Back in November 2025, we made the case for more volatility in 2026, a position that felt fairly contrarian at the time. On the heels of a lackluster 2024 for both corn and soybeans, 2025 was an even flatter year for grain prices. Our measure* of 2025 December corn net volatility for 2025 was just 19 percentage points (ppt), a market that fell 12% below the first close of the year at its worst and rallied only 7% above that close at its best. (In contrast, the average and mean net volatility for corn since 1990 is 35 ppt and 29 ppt, respectively.) 2025 November soybeans were even quieter with net volatility of only 16 ppt vs. an average and mean net volatility of 29 ppt and 24 ppt, respectively.
As 2026 approached, many in the market pessimistically braced for another flat year in the face of seemingly stable fundamentals. However, we took a different, more mathematical approach that cautioned us to prepare for potential change in 2026. Change indeed happened. As August closed out, that change adds an exclamation point with both corn and soybeans posting fresh contract highs.
*Net volatility quantifies the maximum range of prices in any given calendar year. To determine net volatility, we calculate the distance between the maximum price change above and below the first closing price of the year in percentage terms. For instance, in the example above for corn in 2025, the market’s low was 12% below the first close of the year and its high was 7% above. The full range – the net volatility – was then 12 percentage points (ppt) below plus 7 ppt above, equating to a total net volatility of 19 ppt. This approach allows us to standardize volatility across years. All data herein is supplied by Barchart as of 8/31/2026 and included updated 2025 data. Last year’s report used data through 10/15/2025.
Corn: A Wider Range and More of It on the Upside
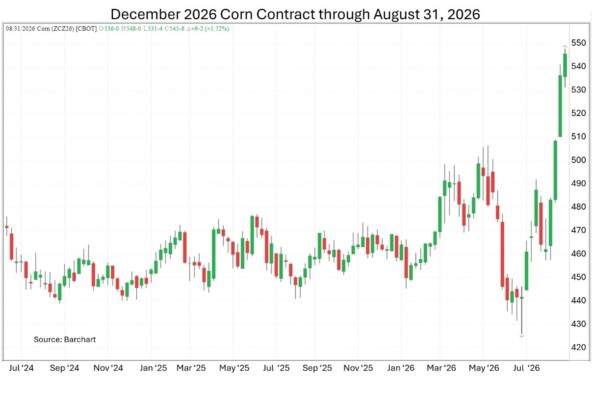
December 2026 corn net volatility came in around 25 percentage points (ppt), up from 19 ppt in 2025. The more telling detail is the shape of the move, not just its size. In 2025, corn spent the year almost entirely on the defensive — down to 12 ppt below the first close of the year and up to only 7 ppt above the first close of the year. In 2026, the market reversed course, setting a new contract low near 425.75 in June (7 ppt below the first close of the year at 458.6) before reversing hard to a fresh contract high above 542 on the last day of August, roughly 18 ppt above the first close of the year. The drivers behind that round trip included less-than-ideal U.S. weather, drought conditions in the western Corn Belt compounded by drought in Europe, and record domestic and global demand for corn.
Soybeans: The Bigger Percentage Jump, With Almost No Downside
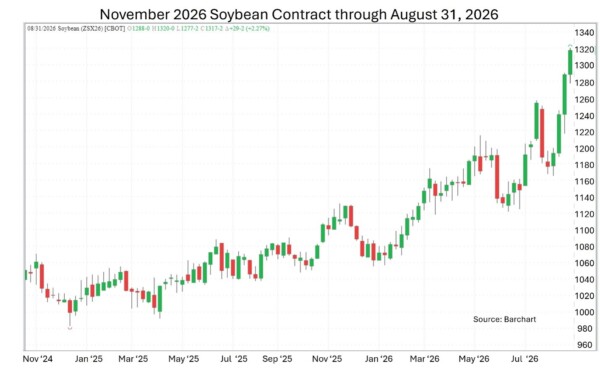
Our anticipated increase in volatility started early for soybeans, right around the time we published our analysis in early November 2025 using 10/15/2025 data. Prior to October 15, the 2025 November soybean contract high occurred on February 4, 2025, settling in around 4.5 percentage points higher than the close on the first trading day of the year. After the start of increased volatility in November, the new high reached 1138.75 on November 14, an 11 ppt jump above the first close of the year, increasing net volatility of only 9 ppt before November to 16 ppt for the year.
That volatility continued into the 2026 November soybean contract’s net volatility of 22 ppt. Unlike corn, 2026 soybeans have not been an up-and-down market. The year’s low was essentially flat versus the first closing price of the year. From there, November 2025 soybeans climbed in almost a straight line to this month’s new contract high of 1294.5 on August 31, about 22 ppt above where the year began. That move tracked closely with the fundamental picture: high fuel and energy prices kept bean oil attractive for renewable diesel production; conflicts in Iran and in Ukraine/Russia added risk premium; and new-crop export demand started the year above average and never really let up.
The Takeaway
Two markets, two very different kinds of “more volatile.” Corn earned its higher net volatility number moving up and down the market, including new lows in June and new highs in August, the kind of two-way action that rewards marketers who stay engaged in both directions. Soybeans earned theirs through sustained, largely one-directional strength, with this week’s fresh high extending a trend that’s barely paused since January.
Both outcomes validate the pattern we flagged last November: a historically quiet year gave way to a materially more active one. For producers, the lesson holds either way: quiet years aren’t a signal to relax pricing discipline. They’re often the setup for the next window of opportunity, whichever direction the market breaks.
Just as importantly, always keep in mind that market sentiment is driven by emotion. Individuals tend to think that whatever happened the most recently is how things will always be. It’s also easy to think that if everyone believes a certain thing to be true, odds are it is. This is why we recommend taking a facts-based, math-based, and sometimes even contrarian approach to marketing. Market strategically and build a plan that allows you to take advantage of wherever the market goes.
Finally, remember that volatility allows you opportunities that a flat market cannot provide.
TFM360 Can Help
For 40 years, the analysts at Total Farm Marketing’s Stewart-Peterson Inc. have evaluated the markets across 40+ market indicators. We have developed models and marketing approaches to help our farmer customers make pricing decisions on their hard-earned production.
Give Total Farm Marketing a call at 800.334.9779 to discuss your situation and how we can help you in your marketing decisions.
©September 2026. Total Farm Marketing. Futures and options trading involve significant risk of loss and may not be suitable for everyone. Therefore, carefully consider whether such trading is suitable for you in light of your financial condition. No representation is being made that scenario planning, strategy or discipline will guarantee success or profits. Examples of seasonal price moves or extreme market conditions are not meant to imply that such moves or conditions are common occurrences or likely to occur. Futures prices may have already factored in the seasonal aspects of supply and demand. The data contained herein is believed to be drawn from reliable sources but cannot be guaranteed. Reproduction of this information without prior written permission is prohibited. This material has been prepared by a sales or trading employee or agent of Total Farm Marketing and is, or is in the nature of, a solicitation. Any decisions you may make to buy, sell or hold a futures or options position on such research are entirely your own and not in any way deemed to be endorsed by or attributed to Total Farm Marketing. Total Farm Marketing refers to Stewart-Peterson Group Inc., Stewart-Peterson Inc., and SP Risk Services LLC. Stewart-Peterson Group Inc. is registered with the Commodity Futures Trading Commission (CFTC) as an introducing broker and is a member of National Futures Association. Stewart-Peterson Inc. is a publishing company. SP Risk Services LLC is an insurance agency and an equal opportunity provider. A customer may have relationships with any of the three companies.
SP Risk Services LLC is an insurance agency and an equal opportunity provider. Issuance of insurance coverage is subject to underwriting review and approval. SP Risk Services LLC is not licensed in all states. Please see the policy for the full terms, conditions, and exclusions. SP Risk Services LLC is an insurance agency licensed to sell certain insurance products and may receive compensation from insurance companies for such sales. Policy obligations are the sole responsibility of the issuing insurance company. Any coverage scenarios are hypothetical and shown for illustrative purposes only. Any claims made pursuant to any policy are adjusted by the issuing insurance company. Insured is responsible for accuracy of information provided to SP Risk Services and its insurance companies. The information included in or available through the website may include inaccuracies or typographical errors. SP Risk Services LLC may make changes or improvements to the website at any time. Information received via the website should not be the sole basis for risk management decisions. Consult a licensed insurance agent (which does not have to be an SP Risk Services LLC agent) for information and advice specific to your situation. Go to https://www.totalfarmmarketing.com/privacy-policy/ for Privacy Notice & Non-Discrimination Statement and https://www.totalfarmmarketing.com/terms-of-use/ for Terms of Use.
Author

Mike Vigneau